Output is half the story
A word count is a clean, honest number, and it is also incomplete. It cannot tell the difference between a thousand words that flowed and a thousand you dragged out by the hair. Both look identical on a bar chart. But only one of them is repeatable, and knowing which is which is the difference between a habit that lasts and one that quietly ends in week three.
That is the gap mood tracking fills. By recording how a session felt next to how much you wrote, you turn a record of production into a record of sustainability. Over a few weeks, the pairing starts answering questions a count alone never could.
What the pattern reveals
- Your best conditions. Maybe your good sessions cluster in the morning, or on the days you wrote before checking email, or on one project and not another. Mood data makes those conditions visible instead of vaguely felt.
- Early signs of burnout. A drift of low-mood sessions, or output holding steady while the writing feels worse and worse, is easy to miss one day at a time and obvious across a month. It is a prompt to rest or change something, while there is still room to.
- The truth about big days. Sometimes the huge word count came at a real cost and the steady, content 600-word days are the ones to build on. Mood is what tells you that.
- Why a project stalled. If one manuscript is consistently the low-mood one, that is worth knowing before you blame your discipline.
How Authorlytica does it
Mood is built into logging, not bolted on. When you record a session, you tag how it felt on a simple scale from very rough to very good. It takes one tap, and you can skip it on any session you like.
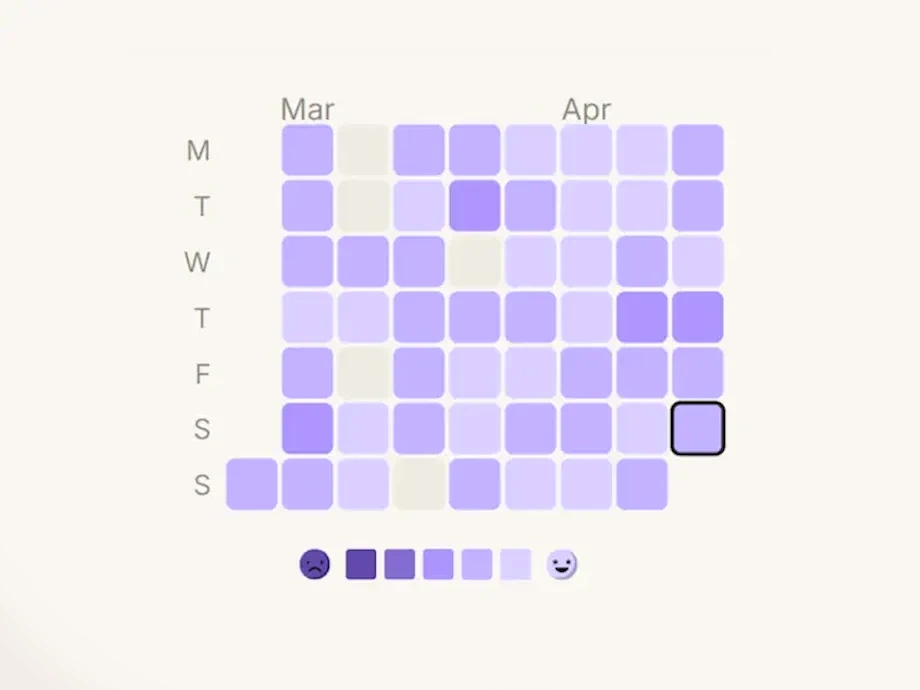
The payoff is the mood history: a calendar-style heatmap where a month of sessions is colored by feeling. The good runs and the rough patches separate visually, and they sit right next to your word counts and streaks, so you read output and experience together instead of guessing at the link. The same signal feeds into your Writer Profile and the Rewind reports, where your Rewind shows not just your biggest month but whether it felt good to write it.
An honest boundary
The short version
How much you wrote tells you whether you hit the goal. How it felt tells you whether you will hit it again next week. Track both and the chart stops being a scoreboard and starts being a map of your own best writing. The fuller picture is in the science of writing streaks and, for anyone whose focus and energy swing hard, the tracker for ADHD writers.